4.1
INTRODUCTION
4.1.1 Unit Locations and the Pattern of an Activity
So far, we
have considered only the locational preferences and decisions of the individual
unit. We now move to a different level of inquiry, in which attention is
focused on the patterns in which similar units array themselves.
We shall
refer to an activity as a category of closely similar location
units.1 In manufacturing, one speaks of an
"industry"—such as flour milling or job printing; in trade or services, of
a "line" of business. We shall extend the term "activities" to cover analogous
groupings, such as residential units of a particular class, types of public
facilities with a particular function, and so on. Thus in a given city, the
fire department is an activity, with a spatial pattern comprising the locations
of fire houses.
Location
patterns can take various forms, as can be seen when one sets out to map the
locations of different activities. The pattern of the copper smelting industry
could be shown as a small number of dots, each representing one smelter.
Fashion garment factories are found mainly in tight clusters (such as in
midtown Manhattan), each of which contains many firms. Automobile dealers in
urban areas tend to be concentrated in linear clusters. Particular crops, or
types of farming, are often found in continuous zones, which they preempt to
the exclusion of any other major activity.
Sometimes
the location pattern of an activity is a planned configuration because there is
just a single decision unit involved. In a nonsocialized economy, however, this
situation is confined essentially to certain types of public facilities (such
as schools within a city school system) and to the few lines of private
businesses that are controlled by total monopolies. More characteristically,
the location pattern of an activity is the unplanned outgrowth of the behavior
of many location decision units.
4.1.2 Competition and Interdependence
As already
noted in Chapter 2, individuals and business firms
(particularly new and small firms) must make location decisions in the face of
great uncertainty, and they are strongly influenced by personal preferences and
constraints not closely related to any calculation of money cost, revenue, or
profit. But the location pattern of an activity as a whole cannot be understood
simply in terms of the factors governing individual unit locations. Here we
have to recognize explicitly the role of competition and other kinds of locational interdependence among units.
First,
there is the process of competitive weeding out and survival. Establishment of
new locations is only one of the ways in which the locational pattern of an
activity is altered. The mortality among new and small firms is high, and
establishments are continually being abandoned or converted to other uses.
Business locations, whether based on wisdom, profound study, personal whim, or
guesswork, have to meet the test of survival.
A good
analogy is the scattering of certain types of seeds by the wind. These seeds
may be carried for miles before finally coming to rest, and nothing makes them
select spots particularly favorable for germination. Some fall in good places
and get a quick and vigorous start; others fall in sterile or overcrowded spots
and die. Because of the survival of those which happen to be well located, the
resulting distribution of such plants from generation to generation follows
closely the distribution of favorable growing conditions, So in the location of
economic activities, it is not strictly necessary to have both competition and
wise business planning in order to have a somewhat rational location pattern
emerge: Either alone will work in that direction.2
To be sure,
the role of the "invisible hand" in promoting efficient location patterns
should not be exaggerated. The survival test may weed out multitudes of small
mistakes in location, though at a substantial cost in wasted resources. Big mistakes associated with large-scale operations— for example, in the
location of a steel mill or a major transport terminal— are considerably
more durable. Not only is the fixed investment greater and the competitive
pressure less threatening, but in addition such a facility radically alters its
environment. It may attract a variety of complementary activities; and, in any
event, it will build up a larger local market, thus partly "justifying itself."
The need for informed planning of locations in order to forestall misallocation
of resources is obviously greater where large-scale units or complexes are
involved. Such major decisions are in fact based on more objective criteria and
fuller information than is the typical small-unit location.
Competition
among business firms is just one of the manifold ways in which locations depend
on one another—a dependence that we conveniently ignored in Chapter 2 when considering just one location unit
at a time. Whether they be factories, stores, public facilities, offices, or
homes, individual location units are never indifferent to locations of other
units of the same kind but can be either repelled or attracted by them.
Proximity can be an advantage or a disadvantage, or sometimes both at the same
time. Our focus in this chapter is on activity patterns shaped by mutual
repulsion among the units, or dispersive forces. We will find that
the nature of competition in a spatial context may contribute to these forces
but that some aspects of spatial competition may have contervailing effects.
Subsequently, in Chapter 5, we will consider the
contrasting kinds of patterns in which mutual attraction, or agglomerative forces, dominate.
4.1.3 Some Basic Factors Contributing to Dispersed
Patterns
Business
firms often go to some pains to select locations where there is no nearby
competition; and householders likewise shy away from too much proximity to
other households, whether from a desire to avoid high rents or congestion, a
desire for privacy, or a dislike for some particular category of neighbors.
These are instances of locational repulsion among units of the same specific or
general type. But several basic reasons for a dispersed pattern can be
identified.
One reason
is competition for scarce local inputs, such as land, privacy, quiet, or clean
air or water. A high concentration of occupancy makes these local inputs more
scarce and more expensive. It also discourages further concentration. The
importance of this effect is so great that we shall devote Chapter 6 to exploring it in detail.
Another
reason for an activity to have a dispersed pattern is that the activity is
output-oriented and its markets are dispersed. Thus an effective demand for
convenience goods exists wherever there are people with income; and a closely
market-oriented activity, such as drugstores, will have a pattern resembling
that of population or consumer income. The individual stores prefer locations
apart from one another, because they are selling basically the same items and
the customers will tend to patronize the nearest store. The demand for the
goods of any one store will be greater where there is little or no nearby
competition. As a result of this mutual repulsion, the stores are widely
distributed. The degree of dispersion (the closeness of fit to the market
pattern) is limited only by the high costs of operating a small store, and the
pattern thus represents an economic compromise between the factors of market
access and scale economy.
Where scale
economies call for still further restriction on the number of separate units
that can survive, we find individual units selecting not just neighborhoods but
cities or regions on a similar basis of avoidance of proximity: They try to
find a relatively undersupplied area where the competition is least intense. In
both the intracity and the intercity situations, the individual unit has a
"market area" within which it has the advantage of better access to the market
than its competitors.
Similarly
there are activities, oriented to the supply of transferable in puts, that tend to have a dispersed pattern because the pattern of input sources
is itself dispersed. Crop-processing activities in agricultural areas are an
example. Individual cheese factories, sugar refineries, and the like repel one
another in the sense that each can get its inputs more cheaply or easily if it
has a "supply area" to itself and is to that extent insulated from
competition.
We shall
now examine more closely these types of activity patterns involving market
areas or supply areas. For brevity’s sake, the discussion will refer
basically to market areas, but it should be kept in mind throughout that the
same principles apply to supply areas as well.
4.2 MARKET AREAS
4.2.1 Introduction
First, we
may note that the importance of keeping a distance from one’s rivals, and
the feasibility of carving out a market area, depend on the degree of
interchangeability of one’s products with those of the competitors. If the
products are not closely standardized, the buyers cannot be relied on to prefer
the cheapest nor to patronize the nearest seller. But if the products are
standardized, there are likely to be considerable scale economies in producing
them, since there is relatively great scope for mechanization and even
automation of processes, and the organization and management problems are
simpler.
Some
economies of large scale refer to the size of the individual establishment or location unit, while others depend primarily on how large the firm or
other decision unit is. The economically justifiable size of the
individual location unit is constrained by the fact that larger size requires a
larger market area and increased transfer costs; but the size of the firm is
not under that constraint and may be associated with such substantial savings
in costs of management, purchasing, research, advertising, and finance that it
is profitable for one firm to operate a number of separate location units.
Branch plants are increasingly common in manufacturing and utilities, as are
chain stores in retailing. Within the past few decades, multiunit firms have
assumed a notably larger role in such activities as hotels and motels,
automobile rental, restaurants, theaters, and university education. This trend
probably reflects, at least in part, the improvement of communications, data
processing, and management techniques, which have widened the scope of
economies of large-scale management more than they have affected the scale of
individual establishments.
Consequently, one of the important types of market-area patterns is
that involving the sales or service areas of different branch units of a
single firm—here the relationship among units is obviously
different from what it is when the units belong to rival firms.
4.2.2 The Market Area of a Spatial Monopolist
The
development of our discussion concerning market-area patterns will be
facilitated if we first understand the factors contributing to the market
boundary of a spatial monopolist. Whether we choose to think of this monopolist
as a branch unit or a single-unit firm with decision-making power is immaterial
at present.
The
characteristic that distinguishes a firm or a particular location unit as
having monopoly power is that when its price is raised, at least some of its
customers will remain. No such advantage accrues to the perfect competitor. Its
demand curve is such that it has no control over price; any increase in price
will cause all of its customers to find alternatives. Most introductory
textbooks in economics stress a number of reasons why monopolies can arise
(patents, scale economies, etc.), but they neglect the fact that space itself
may impart monopoly power. For example, customers in the immediate vicinity of
a grocery store are, in a sense, attached to it. Price increases may be
tolerated by these customers because switching to an alternative supplier would
involve extra time, trouble, and expense. This principle applies equally to
many nonbusiness establishments as well. For example, clients of a local free
legal or health care service may be willing to tolerate increases in waiting
time or other small decreases in the quality of services rendered for much the
same reason. The search for alternatives that might exist in other parts of the
community is costly.
It is
possible to identify the area over which this influence might be exerted by
making use of the concept of delivered price introduced in Chapter 2. For ease of presentation, consider
initially a unit whose customers are evenly distributed over a linear market; for example, strung along a street or other transfer route. We
might think of the seller as charging a uniform f.o.b. price (that is,
price at its own location, before transfer) to all buyers, so that each buyer
must pay that price plus all expenses associated with transfer to his or her
location.
The
arrangements by which the buyer pays transfer costs can take several forms. For
example, the seller may take responsibility for delivery, and may either
move the goods itself or contract with a transfer agency; but in either case it
charges the buyer a delivered price that includes all transfer costs.
Alternatively, buyers may contract with the transfer agency or move the
goods themselves. This last practice is of course common in retail trade, where
the buyer takes possession of the product at the seller’s location. For
our immediate purposes, it is not necessary to distinguish among these
alternatives; in any case we shall assume that delivered price increases with
distance, so that the buyer in effect pays all transfer charges.
Under these
circumstances, it is particularly easy to identify the market area realized by
the seller and to recognize the nature of pricing and output decisions. Let the
price at the seller’s location be denoted by p0 in panel (a) of Figure 4-1. We shall refer to this as the f.o.b.
price. Our assumption that the full cost of transfer is reflected in the price
that buyers pay implies that a buyer located at some distance from the seller,
say d1, would face a delivered price of pI, where
the amount p1— p0represents the
transfer cost component. Note that the slope of the delivered price schedule
shown in panel (a) is determined by the transfer rate. If we think of distance
on the horizontal axis as being measured in miles, then the increment in
delivered price associated with the transfer of one unit over one mile is the
transfer rate.
In panel
(b), the line D represents the demand curve of a typical buyer, and we
shall assume that all individuals in the market have identical demand curves.
This being so, we can identify the quantity demanded by the buyer located at d1 as q1. That is, we recognize
that the quantity demanded depends on delivered price. Using panel (c)
as an intermediary or mapping device to get us around the corner to panel (d),
we can plot the quantity/distance function, which relates the quantity
demanded by a buyer to distance from the seller’s location. Thus an
individual who is adjacent to the seller will purchase the quantity q0, and the quantity demanded is zero when the customer is
confronted with a delivered price of p2• For this
particular f.o.b. price, p0, a "natural" market boundary is
established at a distance of d2, where transfer costs have
limited the range over which the firm may sell its product or
service.
If instead
of focusing our attention on a linear market, we allow customers to be
distributed over the entire area surrounding this seller, some extensions of
this analysis follow immediately. Under this circumstance, one could identify a
quantity/distance function similar to that of panel (d) in every possible
direction. As Figure 4-2 shows, by rotating the
quantity/distance function about the vertical (quantity) axis, we circumscribe
the seller’s market area for a given f.o.b. price. The distance
from the seller’s location to the limit of market is called the market
radius and is denoted by R in Figure 4-2.
This
analysis leaves unanswered the question of how the monopolist chooses to
establish a particular f.o.b. price. To address this issue, we must recall that
a profit-maximizing firm will choose a price that is consistent with its
setting marginal revenue equal to marginal cost. This decision criterion is
common to spatial and nonspatial pricing analysis. However, the nature of
demand, and therefore marginal revenue, is somewhat more complex in a spatial
context.
Consider
Figure 4-1 once more. If the monopolist seller were to set its f.o.b. price at p0, we could measure the total quantity demanded at
that price by the area under the quantity/distance function. That is, at every
unit distance we can read the quantity demanded by the individual at that
location by measuring the height of the quantity/distance function.
If there is
one buyer at every unit distance, the total quantity demanded would be given by
the summation of all the individual quantities.
When the
buyers are evenly distributed in all directions over the area surrounding the
seller, as represented in Figure 4-2, we have what is
called a demand cone. Its height at any given distance from the
seller’s location represents the quantity sold per buyer, and the volume
of the cone represents the quantity demanded over the entire market area if the
price p0 is established at the seller’s location.
It is now
possible to define the firm’s spatial demand curve. For each price,
such as p0, that is set at the seller’s location, a new
demand cone will be established. A lower f.o.b. price implies a larger quantity
demanded, for two reasons. First, because the nonspatial, individual demand
curves are negatively inclined; when consumers are faced with lower prices they
buy more. Second, the lower the f.o.b. price the larger the market radius, and
hence the market area. Thus the number of buyers within the market area of the
firm also depends on the f.o.b. price established. The spatial demand curve
relates f.o.b. price to the quantity demanded over the entire market area,
accounting for these two effects. Such a spatial demand curve is shown in Figure 4-3 and is labeled Ds.
Note that
the spatial demand curve is convex to the origin. Its shape stems directly from
the two effects mentioned above. Because the non-spatial demand curve is
negatively inclined, we expect that higher (lower) prices will decrease
(increase) the quantity demanded in a spatial context as well. However, because
the market area, and therefore the number of customers, changes with each
change in f.o.b. price, we should not expect the relationship between price and
quantity demanded to be linear, even when there is a linear nonspatial demand
curve and when the transfer cost gradient is linear.3 Recognizing the usual tendency of transfer costs and rates to
increase less than proportionally with distance, we find still further basis
for the usual convexity of the spatial demand curve.
Having
established the nature of the spatial demand curve, it is now possible to
extend our understanding of pricing decisions to a spatial context. Let MC in Figure 4-3 denote the locational unit’s marginal cost curve and MRs denote its spatial marginal revenue curve. The
profit-maximizing firm will equate MC and MRs, and
establish the f.o.b. price p*. Once p *is
determined, a demand cone is also established, and its volume will be equal to q*. Note also that the pricing decision results in
establishing a market area for the unit. Thus if we are to understand the
nature of market areas, we must also understand the motivations that guide
pricing decisions.
This
analysis permits us to enumerate some basic determinants of a locational
unit’s market area when the presence of other sellers is not considered.
When f.o.b. pricing is maintained, we must look to the nature of transfer costs
and demand as well as to production costs in order to explain the existence of
a market boundary. It is important to note, however, that if other pricing
strategies are used, the nature of market boundaries may be
affected.
With this
background, we may go beyond consideration of a spatial monopolist in isolation
and recognize that the effective area over which "monopoly power" can be
exercised is often limited by the location of rival sellers. Thus market-area
patterns emerge for various activities.
4.2.3 Market-Area Patterns
The
simplest case of market-area patterns to consider is that involving a
completely standardized output, equal operating costs for all sellers, and
transfer costs increasing linearly with distance. The preceding analysis
defined the natural market area of a seller as being limited by transfer
costs. Potential buyers were confronted by a delivered price, and their
decision to purchase or refrain from purchasing determined the area over which
the monopolist had effective control. If the output in question is standardized
and is offered for sale by more than one establishment, the customer’s
choice is not simply one of whether to buy and how much; he or she must also
decide which seller to patronize. To simplify matters we shall consider
initially market-area patterns that result when all sellers of a standardized
output have equal operating costs, face identical transfer costs that increase
linearly with distance, and establish the same f.o.b. price.
Between any
two sellers’ locations under these conditions, the market-area boundary
will be a straight line that bisects at right angles a line drawn between the
two locations. For all markets on one side of the line, the seller on that side
has the advantage of lower output-transfer cost; on the other side of the
boundary, the other seller has the advantage. In any direction where there is
no competition, a seller’s market area will extend outward to some
limiting distance beyond which there will be no sales at a price that would
cover costs including transfer: That part of the market-area boundary, then,
will be a circular arc. This situation is shown in Figure
4-4 for a set of four competing sellers.
The case
just described is, of course, too simplified to represent any real situation;
but it serves as a convenient point of departure for discovering the effects of
various more realistic conditions upon market-area patterns. First, the costs
at the two selling locations are unlikely in practice to be exactly equal. If
they are unequal, the market-area boundaries look more like the one in Figure 4-5, bending away from the lower-cost
seller’s location. The boundary, in this case, comprises all markets at
which the sellers’ cost differential at their respective locations is
exactly offset by the extra transfer cost from the lower-cost seller.4 Under our assumption of transfer costs rising linearly
with distance, the boundary can never be a closed curve—that is, the
lower-cost seller can never have a market area entirely surrounding that of the
higher-cost seller.
Another
possibility is that the two sellers incur different costs of transfer per ton
per added mile. The result is shown in Figure 4-6 for
a set of three sellers, with B’s transfer costs lower than those of A or C. This might reflect the situation if, for instance, firm B is shipping its product in a more easily transportable form, is
conducting its own transport operation with superior efficiency, or has been
able somehow to make more advantageous arrangements with transport contractors
than have its competitors. The market-area boundary is now a closed curve:
B’s market area completely surrounds those of A and C (the
white areas). In this particular situation, we have the additional curious
result that B cannot sell at its home location but only
elsewhere!
Figure 4-7 demonstrates that market-area surrounding can occur even if both sellers are subject to the same transfer
tariff—simply by virtue of the characteristic long-haul
discounts.
Market-area
surrounding of this type, resulting from the normally convex shape of transfer
rate gradients, is extremely common in practice. Consider, for example, the
circulation area of a major metropolitan newspaper in relation to the
circulation areas of suburban and small-town newspapers in the same region, or
the market areas of "national" brands of beer vis-à-vis those of local
brands. The counterpart in terms of supply areas appears in small-city
milksheds completely surrounded by the large milkshed of a larger city. The
geographic price pattern for the product, in this case, is like that of a land
surface rising to a mountain peak but punctuated with various hillocks and
mounds on the slopes.
4.3 SOME ASPECTS OF SPATIAL PRICING POLICY AND MARKET
AREAS
4.3.1 Market-Area Overlap
So far in
this discussion of market and supply areas, we have concentrated on the
development of market boundaries for fully standardized products. In each
instance the seller’s market area comprises those markets that it can
supply at a lower delivered cost (costs at the seller’s location plus
transfer charges) than the sellers at any other locations. Under these
circumstances, we might expect cleanly defined areas, similar to those mapped
in Figures 4-4 through 4-7.
In
practice, however, market-area and supply-area boundaries are blurred, and the
areas overlap somewhat. This can result from absorption of part of the
added transfer costs of distance by any of the three parties involved: the
transfer agency, the buyers, or the sellers.
In the case
shown in Figure 4-8, the transfer agency is the
absorber. Reference was made earlier, in Chapter
3, to the fact that transfer rate schedules are sometimes simplified by
setting a uniform rate over a whole "mileage block" or range of distances, if
competitive conditions permit. When this is done, there are likely to be zones
where the areas of two or more sellers overlap, as shown schematically in
Figure 4-8. We must bear in mind, however, that the time taken in
transfer is often important as well as the rate charged; and except in
telecommunications and electric energy distribution, longer hauls take more
time. Accordingly, not every case of rate bracketing results in market-area
overlap.
The buyers can be regarded as absorbing some of the extra transfer costs of
distance whenever they do not rigorously observe the principle of buying the
cheapest good or service of a given type. Similarly, they can be regarded as
absorbing some transfer costs if they are doing the transferring themselves (as
in the case of retail shopping), but fail to patronize the most easily
accessible seller. In the real world, the buyer does not often show this
impartiality toward competing sellers, but for one reason or another has a
preference even if the prices are equal. Such preference is least likely to be
an important consideration in business purchases of such standardized goods as
wheat or cement, and it is most likely to occur for retail purchases of such
highly differentiated or even "personalized" items as medical or educational
services, high-fashion clothing, and recreation. It is important to note that
the buyer-preference factor will produce market-area overlap, but only to the
extent that buyers have diverse preferences. Thus in Figure 4-9 (where it is assumed that A produces
more cheaply than B), the line CC might be the market-area
boundary for buyers who are indifferent to the relative qualities of A’s and B’s wares and would simply choose whichever is
cheaper at their location. For those who believe that A’s product
is really worth 5 cents a pound more than B’s, the boundary will be DD, which runs through points where the delivered cost from A is
5 cents greater than that from B. For those who believe that B’s is worth 5 cents a pound more than A’s, the boundary will be FE. Assuming that at every location there are buyers representing the whole
intermediate gamut of preferences, the "boundary" or zone of overlap will
comprise the belt between DD and FE. Both A and B will make sales throughout this overlap zone, though each will predominate
in the part that is closer to him or her.
Finally, it
may be sellers who are absorbing some of the added costs of distance.
This is quite common. Indeed, the one case where this is not likely to
happen is the special case mentioned earlier, in which the sellers are branch
units of a single firm, public agency, or other multilocation decision unit. It
is ordinarily in the interest of a firm or agency to distribute the product
from its various facility locations in such a way as to minimize the total cost
of supplying any given pattern of demand. This will ordinarily rule out cross-hauling or overlap of the market areas of those facility locations
(except to the extent that it might reflect transfer cost absorption on the
part of buyers or transfer agencies, as already considered). Accordingly,
specific sales territories are allotted to the various branches. These market
areas tend to be larger for branches with lower cost or higher capacity, and
larger where demand is sparse than where it is dense.
Such
definitive demarcation of areas is even more prevalent in public and
administrative agencies. The Federal Reserve System divides the United States
into twelve districts, and within some districts there are subdistricts such as
that of the Pittsburgh branch of the Cleveland Federal Reserve Bank. Similarly,
every federal government agency with field activities has its set of districts
exclusively allocated to their respective branch office.5
In other
activities, however (including most lines of business), the market rivalry
between selling locations mainly involves rival firms, rather than different
branches of the same firm. This situation introduces considerable possibilities
for transfer cost absorption and consequently market-area overlap, depending on
the pricing policies that the firms find advantageous.
4.3.2 Spatial Price Discrimination
Thus while
we have assumed f.o.b. pricing in much of the preceding analysis, many other
pricing policies can be established.6 If at any one
location there is just a single seller or a small enough number to cooperate
with one another, there are inviting opportunities to extend that
location’s market area by "absorbing freight"—that is, discriminating
in favor of more distant buyers. The extreme situation involves complete freight absorption, with the seller paying all transfer charges (but
presumably setting a price that covers average delivery costs plus other
costs). In that case, each seller sells at a uniform delivered price to
buyers in various locations but receives a smaller net revenue per unit on its
sales to the more distant buyers. Each seller then can afford to serve only
those markets within a maximum distance determined by how much transfer cost it
can afford to pay and still cover its out-of-pocket costs. Market areas will
overlap if the sellers are sufficiently close together. In the zone of overlap,
all the participating sellers share equally in sales. It is still to the
interest of each seller (insofar as it is market-oriented) to locate close to
concentrations of demand and far from competitors.
More
sophisticated pricing policies entail a partial and selective absorption of transfer costs by the seller: Neither the f.o.b. price nor
the delivered price is uniform on sales to different markets. The resulting
patterns of prices and market areas will depend largely on the extent to which
competitive pricing is based on short-term or long-term advantage.
The various
sellers may take a long-term view of the possibilities and decide that they
will all be better off the more closely they can collectively approximate the
behavior of a single profit-maximizing monopolist. Such a monopolist, if it
likewise took a long-term view, might well set its prices somewhat below levels
that would yield the maximum immediate profit, in order to avoid encouraging
the entry of new firms.
If the
sellers do pursue such a policy of complete collusion, cooperation, or
foresight (whichever term may be appropriate for the ease in hand), they will
behave like branch units of a monopolistic firm or agency, which means that in
general they will observe clean-cut market-area boundaries and avoid
unnecessary transfer costs, such as might be involved in cross-hauling. There
could still be market-area overlap, but only to the extent that the transfer
agency or the buyers absorb transfer costs in the ways discussed earlier
(involving mileage-block rates and qualitative preferences
respectively).
How much of
the transfer charges will be absorbed by the sellers assuming they are not
under any external prohibition against spatial price discrimination?
Presumably, the answer will be the same regardless of whether we consider an
actual monopoly with separate branch locations or a set of sellers at different
locations who find it in their mutual interest to price as would a single
monopoly.
It turns
out that (if we assume linear demand schedules at the markets) the sellers will
maximize their profits by systematically discriminating against the nearer
markets, absorbing exactly half of the transfer expenses.
(The
remainder of this subsection may be skipped without loss of
continuity.)
In order to
appreciate this, consider the pricing decision depicted in Figure 4-10. The lines Daand Dbrepresent (nonspatial) demand curves associated with two
buyers who have identical preferences and income but who reside at different
distances from the seller’s location. We will assume that a buyer who is
located adjacent to the seller (at distance 0) has the demand curve Daand that the other buyer is located some distance
away.
The demand
curves in Figure 4-10 are drawn from the
seller’s perspective, in that they show the relationship between the
quantity demanded and the net price received by the seller—that is,
delivered price less transfer costs. The vertical distance p0, — p’0between demand curves is a measure of the
transfer costs between the two locations. The seller realizes that for any
given quantity, the buyer represented by Dbwould be willing
to pay a lower net price for the good in question because of the transfer costs
associated with the buyer’s more distant location. Conversely, for the
same f.o.b. price established by this seller the more distant buyer would be
willing to purchase a smaller quantity. Thus distance affects demand, and this
distinguishes otherwise identical buyers in the eyes of the seller.7
For
simplicity, let the marginal costs of production be equal to zero.8 The marginal cost curve then coincides with the quantity
axis. A monopolist equating marginal revenue and marginal cost in each market
(that is, for each buyer) would establish an f.o.b. price of p’1 for that which is adjacent to its
location and a price of p’1 for that which is
more distant.
The
difference in f.o.b. prices, p1 — p’1, is exactly one-half of the transfer cost
to the more distant customer. For the proof of this statement refer to Figure 4-11, where the demand curve Da has been reproduced. The marginal revenue curve (MRa) associated with this demand curve bisects the quantity axis.9 Thus q1 =(1 /2)q0.
Further, it is also the case that p1=(1/2)p0. The reason for this
is that the triangles 0p0q0 and p1p0c are similar. Therefore,
since p1c =(1/2)0q0, it follows that p1p0=(1/2)0p0or,
alternatively, p1 =(l/2)p0.
With this
in mind, we may refer to Figure 4-10 and state
that
p1 —p’'1 =(1/2)p0 — (1/2) p’0
=(1/2)(
p0 — p’0).
Since p0 — p’0 is the transfer cost
to the more distant location, we see that the monopolist has absorbed exactly
one-half of these costs by setting a lower f.o.b. price for the more distant
buyer.10
If the
sellers’ locations and the market locations are given, the market-area
boundaries will be in the same places regardless of whether the sellers follow
this ideal discriminatory pricing policy or a nondiscriminatory policy under
which delivered prices include the full transfer costs. Indeed, the areas will
still be unchanged if the monopoly firm or the monopoly-simulating set of
sellers chooses to absorb all of the transfer charges and sell at a flat
delivered price, while at the same time choosing to avoid cross-hauling. This
situation will, of course, require that the market-area boundaries as well as
the uniform delivered price be agreed to and specified.
4.3.3 Pricing Policy and Spatial Competition
If the
individual sellers are not so far-seeing or cooperative as we have here
assumed, they will try to invade one another’s market areas by cutting
prices. Consider the situation diagrammed in Figure
4-12, where sellers at A and B are competing for markets
along the line between them, AB. The out-of-pocket costs of the two
sellers at their own locations are AC and BD. Each, initially, is
selling on the basis of an ideal system of price discrimination in favor of
remote buyers and absorbing half the transfer costs; thus A’s delivered prices follow the gradient EF, and B’s follow the
gradient GF. The lines CI and DH represent out-of-pocket
costs plus full transfer costs from A and from B respectively. It
should be noted that the ideal discriminatory delivered prices EF and GF rise at exactly half the slope of CI and DH, since the
sellers are systematically absorbing half of the transfer costs. The
market-area boundary is at L, where the delivered prices are both equal
to FL.
In this
situation, A may see a short-run gain in undercutting B’s delivered prices to points as far as M, thus stealing the market
territory LM away from B. The possible invasion cannot go any
farther, however, because when firm A sells to point M at a
delivered price MI it is barely covering its out-of-pocket costs
including transfer charges. Firm B can logically be expected to
retaliate by cutting its delivered prices along the whole stretch KM, thus staging a counterinvasion of A’s market area. Carried to
its logical conclusion, this game will produce a delivered price schedule EHJIG. Between K and M, A and B will be sharing the
market. What will have happened is that the market-area boundary will now be a
zone rather than a line; the sellers will both be making less profit; and the
pattern of locational advantage for the buyers will have been changed, with
locations in the competitive zone KM having now become more economical
than they were before. The shaded area in the figure shows the maximum extent
of price cutting.
The various
cases discussed do not by any means exhaust either the theoretical
possibilities or the variety of spatial pricing systems actually used by firms.
Notably, there is the "basing-point" system, which
has at various times been used in selling steel and other products. It is most
often used in situations where the sellers are few and their market orientation
is strongly constrained by access to transferable inputs, large-scale
economies, and large fixed investments, and where the amount and location of
demand fluctuate widely. In a basing-point system, a distinct pattern of
delivered prices is observed: The price at any market is the lowest sum of the
fixed f.o.b. price at a basing point plus the actual transfer charges from the
basing point to the market. That is, sellers base their price on that charged
at some other place, the basing point. For example, the place used as the
basing point may be the largest supplying area for the commodity being sold.
Thus unless government price regulation is in force, one might find that the
price of crude oil in any U.S. city is based on the price established by the
Organization of Petroleum Exporting Countries (OPEC) for crude oil from the
Persian Gulf. In this case, an American producer who is shipping crude oil from
Houston to Chicago might charge a price equivalent to the price of OPEC crude
oil delivered to Chicago.
The
economic incentive for a pricing system of this sort is easy to understand. If
the producers in a given region (or country) cannot produce enough to satisfy
local demand at the equilibrium price, local producers would be giving up
profits if they charged any price lower than that of an identical commodity
being imported by the region (country). The price of OPEC oil delivered to
Chicago represents the maximum price that can be charged by the Houston
producer. Unless there is competitive undercutting of price by other producers,
the OPEC price can prevail.
In such a
system, all sales entail either freight absorption or phantom freight charges, except those by a seller at a basing point to markets within the
area governed by its basing point; there is likewise a considerable amount of
market-area overlap and cross-hauling. For further discussion of this and still
other variants, the curious reader will have to look elsewhere.11
4.4 COMPETITION AND LOCATION DECISIONS
The
preceding discussion of market areas and spatial pricing policies has described
the behavior of sellers at given locations. We have recognized one
important dimension of competition in a spatial context: the ability of
locational units to absorb transfer costs. Thus spatial pricing policies serve
as one mechanism by which firms may seek to gain competitive advantage. We now
proceed by recognizing that the choice of location may itself be part of a
competitive strategy.
In order to
establish a simple framework for exposing the essential character of this
aspect of spatial competition, we draw on a model developed by Harold
Hotelling.12 Our attention will be focused on two competitors who
confront a linear-bounded market. It is assumed that production costs are zero
for each locational unit. Identical buyers are evenly distributed over this
market. Their demand for the good in question is not sensitive to price
differences (the elasticity of demand is zero). One unit of the good is
consumed by each individual per period of time, and each buyer prefers to
purchase from the nearest seller.
This
situation is depicted in Figure 4-13. In panel (a),
the linear market, l, is segmented into two protected or uncontested
parts, a and b, and one contested part, x + y, that
is shared equally by the sellers. The two sellers, A and B, can
move to any location on the line that will maximize their profit, and they do
so believing that the rival will not change its location in response to their
competitive action. We will assume that these moves are costless, in the sense
that the sellers confront neither moving costs nor costs associated with
disposing of fixed assets that might be associated with a given
location.
In the
restricted environment established by these assumptions, profits are always
enhanced if a seller increases its market area. Since production is costless,
larger market areas imply greater sales and, therefore, greater
profits.
If each
seller believed that the other’s location was fixed, the first seller to
act, say A, would move to a position adjacent to its rival, ensuring
itself the largest possible market area. If the initial positions are as
depicted in panel (a), the first seller to move would seek to eliminate the
contested portion of the market and maximize its protected portion. Thus panel
(b) would represent such a move. The second seller is similarly motivated,
however, and would leapfrog its rival to obtain competitive advantage. This
type of movement would continue until neither seller stood to gain from further
action. Such a situation would prevail if both sellers assumed central
locations, each sharing one-half of the market.
These
results demonstrate that some aspects of spatial competition may actually lead
to the mutual attraction of sellers. In Chapter 5, other factors that might encourage
clustering of this sort are examined in depth.
Some
individuals have claimed great generality for Hotelling’s model,
suggesting that it explains a good deal about spatial groupings of activity.
This suggestion is difficult to justify, however, when one recognizes that
attempts to move the model closer to reality by relaxing one or more
assumptions have consequences that are very much at odds with Hotelling’s
results. 13
The
validity of this point is apparent if one explores the implications that follow
when one assumes that the demand elasticity is non-zero and also allows for the
possibility that sellers may act in light of a belief that rivals will react by
competitive pricing or location decisions.
In earlier
sections of this chapter, we have recognized that if the quantity demanded by
individuals is sensitive to price, a seller that offers its goods for sale at a
lower delivered price may be able to extend its market to include customers who
are physically closer to competing establishments. Thus both price and location
decisions can enter competitive strategy. In Hotelling’s model, not only
was the demand elasticity equal to zero, but each seller’s expectation
about the behavior of its competitor was naive; no change in the rival’s
location was assumed. Now we wish to admit price responsiveness and somewhat
more realistic expectations about competitive reactions in order to appreciate
more fully the complexity of related problems.
While many
possibilities might be examined that would serve to expose the character of
decisions in this context, we choose to concentrate on two examples:14 (a) each seller assumes that any competitive price or
location action that it takes will be matched by its rival, or (b) each seller
assumes that its price changes will be met but that the rival’s location
is fixed.
We continue
to assume that there is a bounded linear market with uniformly distributed,
identical buyers. Now, however, we also assume that they have negatively
inclined linear demand functions. As with the Hotelling model, the sellers can
move without cost and their marginal costs of production are zero; but we
extend our assumptions concerning the sellers to include f.o.b. pricing with
freight rates that are uniform over the market. The sellers are also profit
maximizers.
Under these
conditions, in situation (a), where each seller believes that price and
location changes will be matched, neither seller can expect to gain from
competitive behavior. Each believes that any attempt to lower the f.o.b. price
in order to invade the rival’s market will be met and that the original
boundary between the two sellers will be reestablished at that lower price.
Similarly, each seller expects that any relocation aimed at invading the
rival’s market will be matched and that the boundary separating the rivals
will be maintained. Further, movements toward the rival inevitably imply
movements away from buyers in the seller’s uncontested market segment. The
associated increases in delivered price will affect demand.
There is pressure to avoid
competition because of these circumstances. In fact, it has been suggested that
a possible outcome in this situation would be for the sellers to cooperate and
share the market equally, to their mutual advantage.15
In situation (b), price
competition is eliminated. However, since each seller believes that the
other’s location is fixed, both will move toward a central
location. These moves are again at the cost of sales in the uncontested market
segments as delivered prices rise for more distant consumers. Further, as in
situation (a), there is no gain in the contested market segment. As both
sellers approach the center, the interior boundary is unchanged.
Here, after
their initial move toward the center, both sellers would realize that further
movement in that direction would result only in additional losses. The tendency
toward central locations has been checked as a result of competitive pressure
and decreased sales to more distant customers. Thus we find that
Hotelling’s results are very sensitive to assumptions concerning the
nature of demand. Specifically, the elasticity of demand (which determines the
extent of lost sales to the more distant customers) can be a factor in
encouraging dispersed patterns of economic activity.
Once we
admit possibilities of the sort just described, it is easy to recognize the
complexity of the decisions faced by the firm. It must develop expectations
about the behavior of competitors before choosing an initial location or
deciding to relocate. Further, its pricing and location decisions are
undertaken with the risk of retaliation. Any seller is likely to have little or
no solid information on which to make the sort of judgments that are
required.
Thus in
addition to the substantial risks that may exist in any location or production
decision because of uncertainty concerning market conditions, competition also
implies uncertainty.16 The costs of guessing
incorrectly may be substantial, and location decisions are undoubtedly
influenced by this reality. In reacting to increases in uncertainty, firms will
make more conservative production and location decisions: Their location
choices, it has been suggested, are likely to reflect relatively smaller
commitments of physical capital, and they will seek the security of locations
with a variety of supply sources and good access to alternative
markets).17
4.5 MARKET AREAS AND THE CHOICE OF LOCATIONS
4.5.1 The Location Pattern of a Transfer-Oriented
Activity
In light of considerations
thus far discussed, we can now formulate some general propositions about the
locational preferences of a transfer-oriented activity.
Regardless
of the price strategy involved, an output-oriented seller will still try to
find the most rewarding location in terms of access to markets. It will not
simply be comparing individual markets nor, as a rule, access to all markets
wherever situated. Rather, it will have to evaluate the advantage of any
location on the basis of how much demand there will be within the market area
that it could expect to command from that location. Each location that it might
choose entails a market area and a sales potential determined by where the
buyers are and where the competition is.18
The best
location from this viewpoint is one where demand for the seller’s kind of
output is large relative to the nearby supply. This suggests that the seller
will look for a deficit area, one into which the output in question is
flowing, in preference to a surplus area, one out of which it is
flowing. The direction of flow is "uphill," in the sense of an increasing price
of the output; thus the seller will be attracted toward peaks in the pattern of
prices, rather than toward low points. In other words, it will try to find the
largest gap in the pattern of already established units of its activity
as the most promising location for itself. If demand for the outputs of its
activity were distributed evenly, the seller would simply look for the location
farthest from any competition: that is, the center of the largest hole in the
pattern. Since any new unit will aim to fill gaps in this way, the tendency
will be toward an equal spacing of units of the activity, with market areas of
approximately equal size and shape.
Analogously, input-oriented location units will look for surplus
areas for that input; and if the supply curve for the input is the same over a
large area, the units will tend to distribute themselves equidistantly, with
supply areas identical.
In the real
world, of course, no such regularity is found. Neither demand nor supply is
spread evenly, competitors and sites are not identical, transfer costs are not
the only factor of location, and transfer costs do not rise regularly with
distance in all directions.
4.5.2 Transfer Orientation and the Patterns of Nonbusiness
Activities
As was
noted earlier, market areas and supply areas are not peculiar to
profit-motivated activities. Public agencies, and a variety of private and
semipublic institutions whose outputs and inputs are mainly services given
rather than sold, are likewise subject to the factors of transfer cost and
scale economy that give rise to market-area or supply-area patterns. In some
cases, the boundaries of such service areas are administratively defined and
perfectly clean-cut; for example, police or electoral precincts, dioceses, tax
collection districts, areas of citizens’ associations, or chapter areas of
a fraternal lodge or professional association. In others, there is a
considerable market-area overlap. Thus church worshipers or communicants need
not choose the nearest church of their denomination; and colleges, welfare
agencies, and social clubs likewise compete spatially, though generally they
have limited areas of market dominance. There are always added transfer costs
in operating at a greater distance, but these can be absorbed by the provider,
the transfer agency, or the recipient of the service.
The
principle of mutual repulsion among units of the same transfer-oriented
activity likewise holds good in many nonbusiness activities. Thus a
philanthropic agency, group, or individual setting up neighborhood recreation
centers or nursery schools in an urban ghetto will be able to give better
service if the units are spaced so that they are more accessible from different
parts of the "market," and each will have its "market area."
Still
further extension of the concept of attractive and repulsive forces is involved
when we recognize such factors as the individual’s desire for privacy.
Human beings and other animals have strong preferences for maintaining certain
critical distances from their fellows, when interacting socially or even when
simply minding their own business, and social anthropologists have uncovered
some interesting ethnic and intercultural differences as to what is regarded as
the optimum degree of proximity. The study of these preferences and their
physical and psychological bases has obviously much to contribute to our
understanding of the stresses induced by crowding and to the proper design of
facilities for urban living—here as elsewhere, the economist becomes
keenly aware of the limitations of a narrow disciplinary approach in dealing
with complex human problems.19
4.6 SUMMARY
The
location pattern of an industry or other "activity" changes partly as the
result of deliberate moves or choice of new locations, but also as the result
of the competitive survival and growth of well-located units and the
disappearance or shrinkage of badly located ones.
In some activities, the
principal locational interaction among the units is mutual repulsion—each
seeks to keep its distance from others. This is generally the case when the
activity is market-oriented and the market is dispersed, or when the activity
is input-oriented and the sources of input are dispersed. In the former case,
each unit has its own market area; in the latter, each has its own supply area.
In general, statements about market areas of sellers can be applied, mutatis
mutandis, to supply areas of buyers.
The concept
of demand in a spatial context is somewhat more complicated than that
associated with nonspatial analysis. The process by which firms make price and
output decisions reflects the fact that customers are distributed over
space.
The
market-area boundary between two sellers of the same good, with equal
production and input costs, is a straight line midway between the sellers. If
one seller has a cost advantage, the boundary will be farther from it and
concave toward its higher-cost competitor. If sellers do not pay the same
transfer rates per mile, or if transfer rates are less than proportional to
distance (as is quite usual), the higher-cost sellers can have their market
areas completely surrounded by those of lower-cost sellers. Market-area overlap
is common and can reflect absorption of transfer costs in the overlap zone by
sellers, buyers, or the transfer agency.
The complex
nature of competitive spatial pricing and location decisions is a source of
substantial uncertainty to firms. They must be concerned with the actions and
reactions of rivals. Some competitive pressures may actually draw sellers
toward more central locations, but the potential loss of sales to customers in
outlying areas serves, at least partially, to offset this tendency.
TECHNICAL TERMS INTRODUCED IN THIS CHAPTER
|
Activity |
Surrounded market or
supply areas |
|
Locational
interdependence |
Absorption of transfer
cost |
|
Dispersive and
agglomerative forces |
Cross-hauling |
|
F.o.b.
pricing |
Basing
point |
|
Quantity/distance
function |
Phantom
freight |
|
Demand cone |
Deficit
area |
|
Spatial demand
curve |
Surplus
area |
|
Natural market (or
supply) areas |
|
SELECTED READINGS
Brian J. L.
Berry, Geography of Market Centers and Retail Distribution (Englewood
Cliffs, N.J.: Prentice-Hall, 1967).
Melvin L.
Greenhut, Microeconomics and the Space Economy (Chicago: Scott,
Foresman, 1963).
M. L.
Greenhut and H. Ohta, Theory of Spatial Pricing and Market Areas (Durham, N.C.: Duke University Press, 1975), Chapters 1-6.
David D.
Haddock, "Basing-Point Pricing: Competitive vs. Collusive Theories," American Economic Review, 72, 3 (June 1982), 289-306.
Harry W.
Richardson, Regional Economics (Urbana: University of Illinois Press,
1978), Chapters 2-3.
Daniel F.
Spulber, "Spatial Nonlinear Pricing," American Economic Review, 71,
(December 1981), 923-933.
Charles M.
Tiebout, "Location Theory, Empirical Evidence, and Economic Evolution," Papers and Proceedings of the Regional Science Association, 3 (1957),
74-86.
Michael J.
Webber, Impact of Uncertainty on Location (Cambridge, Mass.: MIT Press,
1972), Chapters 5-8.
APPENDIX 4-1
Conditions Determining the Existence and Size of Market
Areas
Among the
spatial pricing policies that may be adopted, several have been given special
attention in the literature concerning this topic. These include the
establishment of (1) a uniform f.o.b. price, (2) a uniform delivered price, and
(3) selective price discrimination.20 These
policies are directly related to the amount of transfer costs that a seller
chooses to pass along to customers. Thus f.o.b. pricing is defined as a
situation where each customer pays the full cost of transfer to his or her
location, whereas under uniform pricing a single price is charged to all
customers regardless of their location, and in effect some customers pay more
than the actual transfer costs to their location while others pay less. In
Section 4.3.2 it was demonstrated that with linear demand curves, optimum
discrimination would require that one-half of the transfer charges be passed
along and one-half be absorbed by the seller.
The pricing
policy will have important effects on the size of the seller’s market area
and the seller’s profits. It will even determine the conditions under
which sales from a particular location are viable, in the sense that they are
consistent with the seller realizing normal profits. In order to demonstrate
these points, we shall make use of some theoretical results obtained by Martin
Beckmann concerning the pricing decision of a spatial monopolist.21
The
following analysis applies to a highly simplified situation. Demand for the
seller’s product is uniform over the whole area, sales per unit of area
being g (h — m) where m is the delivered price and h is the price above which no one will buy; g reflects the
"market density." Transport costs are uniformly t per unit quantity and
distance. The total costs of production are given by f + qc, where f is fixed cost, c is unit variable cost (=marginal
cost), and q is volume of output. To simplify the analysis still
further, market areas are treated as if they were circular in all cases.
Distance of a buyer from the selling center is denoted by r, and the
market area radius by R.
Under these conditions,
Beckmann22 has shown that a monopolistic seller
can maximize its profits by setting prices as follows:
| |
No Freight Absorption (Uniform
f.o.b. Price |
Full Freight Absorption (Uniform
Delivered Price) |
Optimum Discrimination
(50 Percent Freight
Absorption) |
Net (f.o.b.)
price |
(h + 3c)/4 |
—rt + (3h + c)/4 |
(h + c)/2 |
Delivered
price |
rt + (h + 3c)/4 |
(3h + c)/4 |
(h + c + rt)/2 |
Trade-area
radius* |
3(h
— c)/4t |
3(h — c)/4t |
(h — c)It |
*In the f.o.b. and
optimum-discrimination cases, delivered price rises with increased distance
from the market and at the edge of the market is equal to h (the price
at which buyers stop buying). It is assumed that in the case of flat
delivered price, the seller will refuse to sell to buyers beyond the
trading-area boundary: Though they would be willing to buy, the seller could
not cover its variable cost and transfer cost on such sales.
It will be observed that
the optimum radius is greatest with 50 percent freight absorption, and is
three-quarters that size (that is, the area is 9/16 as large) under
either zero or 100 percent freight absorption.
The maximum profits
attainable by the monopolist are:
1. With uniform f.o.b.
price:
0òR 2prg(p — c) (h — p — rt)dr — f
where p =f.o.b.
price. This reduces to
(9pg/256) [(h — c)4/t2] —
f=.110g[h — c)4/t2] — f
2. With uniform delivered
price:
0òR 2pfg(m — c— rt)(h — m)dr — f
where m =delivered
price. This reduces to
(9pg/256) [(h — c)4/t2]
—f=.110g[(h — c)4!t2] —
f
the same as in the case of
uniform f.o.b. price.
3. With optimum
discrimination:
0òR 2prg[(h — c — tr) /2]2dr — f
This reduces to
(pg/24) [(h — c)4 It2] — f=.131g[(h — c)4/t2] — f
It appears, then, that the
returns applicable to fixed costs (that is, profits + f) for any given
set of cost and demand conditions will be about 131 / 110=1.19 times as large
under optimum discrimination as under either uniform f.o.b. or uniform
delivered pricing.
The threshold conditions
that have to be met in order for any seller to establish a trading area are
shown by setting maximum profits at zero. These conditions are as shown
below:
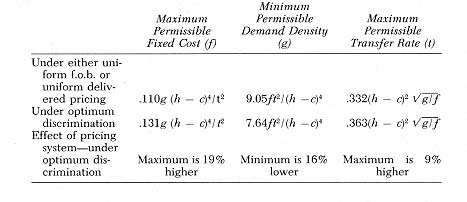
It is clear
from these results that the chances for the existence of trading areas
are favored by (1) lower fixed costs, (2) higher market density, (3) cheaper
transfer, and (4) the exercise of rational price discrimination.
The size of trade areas, once they exist, is another question. The first table in
this appendix shows that, for a monopolist, the most profitable trade
area will be larger when transfer is cheaper (R is inversely related to t) and is independent of both fixed costs and demand density. When there
is competition among sellers, trading areas will be larger if fixed costs (f) are greater or if demand density (g) is lower, but depend in
a more complex way upon the levels of t, h, and c and the kind of
pricing system the competitors use.
ENDNOTES
1. Martin Beckmann, Location Theory (New York: Random House,
1968), adopts a different terminology, in which "activity" corresponds to what
we have been calling ‘location unit," and "industry" to what we call
"activity."
2. E. M. Hoover, The Location of Economic Activity (New York:
McGraw-Hill, 1948), p. 10. This point is further developed in Armen A. Alchian,
"Uncertainty, Evolution, and Economic Theory," Journal of Political Economy, 58 (June 1950), 211-221; and in Charles M. Tiebout, "Location Theory,
Empirical Evidence, and Economic Evolution," Papers and Proceedings of the
Regional Science Association, 3 (1957), 74-86. Tiebout (p. 85) cites the
case of brewing, in which "in the evolutionary struggle to survive, Milwaukee
gained the dominant position," and that of the automobile industry, in which
Detroit emerged as chief victor in the struggle. In both instances, personal or
other "fortuitous" factors played a large part in the initial
locations.
Another
interesting case is that of the Hershey Chocolate Company, an early giant in
its industry. Milton Hershey, having made candy successively but not very
successfully in Philadelphia, Chicago, Denver, New York, and Lancaster, Pa.,
finally chose a rural Pennsylvania Dutch location for his famous factory and
planned town of Hershey—largely because that was his birthplace. A rural
location for a large candy factory was then almost unheard-of, and few expected
him to survive. But the location happened to be an excellent choice in terms of
access to milk and imported cocoa beans, nearness to the largest centers, and
labor supply. Without those economic advantages, Hershey would probably have
failed again. Joseph R. Snavely, Milton S. Hershey, Builder (Hershey,
Pa: privately printed, 1935)
3. It can be shown that the spatial demand curve will be convex to
the origin (concave from above) regardless of the shape of the nonspatial
demand curve. See M. L. Greenhut and H. Ohta, Theory of Spatial Pricing and
Market Areas (Durham, NC.: Duke University Press, 1975), pp.
19-20.
4. If transfer costs rise linearly with distance, and if seller
A’s costs are $1 a ton lower than seller B’s, the distance of
any point on the boundary from A will exceed the distance of that point
from B by a fixed amount—the distance for which the line-haul cost
of transfer is $1 a ton. The shape of the market-area boundary will be a
hyperbola, since a hyperbola can be defined as the locus of all points whose
distances to two fixed points differ by a fixed amount.
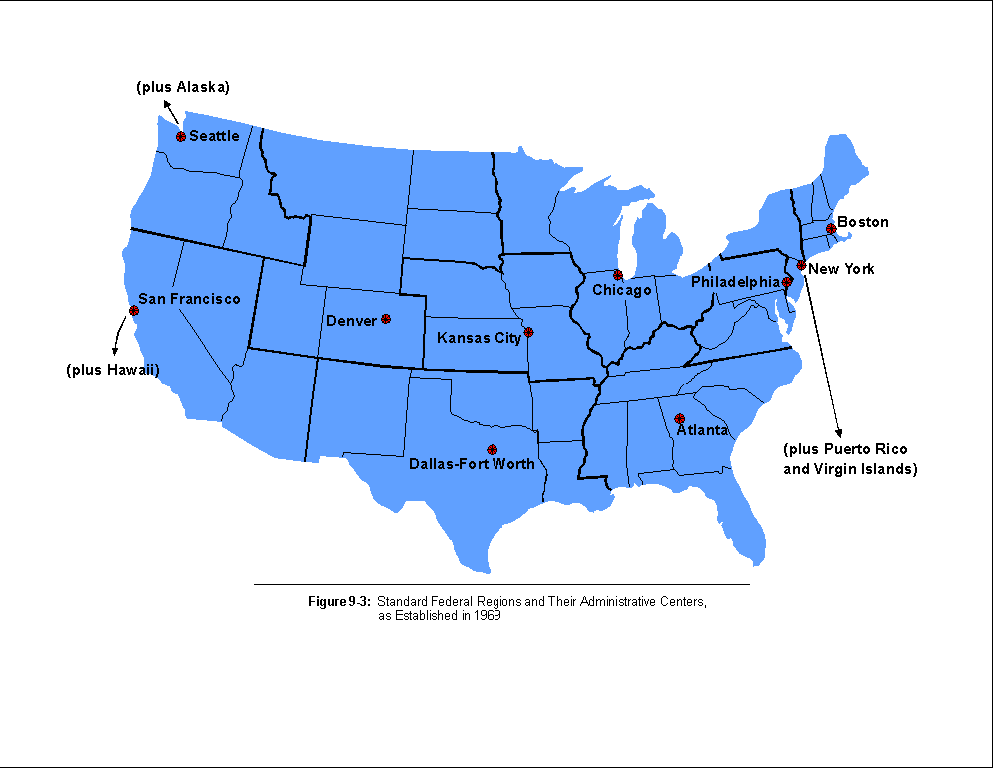
5. See also map Figure 9-3 and accompanying
discussion.
6. The seller’s choice among spatial pricing policies may affect
the size of the market area, profits, and even the feasibility of carving out a
market area. See Appendix 4-1 for a discussion of the
relationship between pricing policies, profitability, and the existence and
size of market areas.
7. Note that the more distant buyer has a greater elasticity of
demand at any f.o.b. price established by the seller. This follows from the
fact that the elasticity of demand is defined as —[(dq/dp)(p/q)j. Since the slope, (dq/dp), is constant over the entire length of each
demand curve and is the same for both demand curves, the fact that the more
distant buyer would be willing to purchase a smaller quantity at any given
f.o.b. price means that his or her demand curve is more elastic. Thus the
feature that distinguishes these buyers, from the seller’s perspective, is
this difference in their demand elasticity.
8. This assumption makes the graphical presentation to follow
considerably easier and does not alter the conclusion. That this is true can be
seen from the mathematical statement offered in footnote 10.
9. For any linear demand curve, the associated marginal revenue curve
is exactly twice as steep and, therefore, bisects the line bounded by the
origin and the quantity intercept. See Richard G. Lipsey and Peter 0. Steiner, Economics, 6th ed. (New York: Harper & Row, 1981), pp.
242-243.
10. This conclusion can also be reached algebraically as
follows: Assume that at any market the sales are a — bp, where p is
the delivered price, and that variable costs per unit of sales are c. Net receipts from sales to any market, over and above transfer expenses and
variable costs, are then (a — bp) (p — c — t),
where t is the unit transfer expense to that market. By
differentiating this expression with respect to p and setting the derivative to
zero, we find that the net receipts are maximized if p, the delivered price, is
equal to [(c + a/b)/2] + t/2. The first term in
this expression is the price that buyers are to be charged at the seller’s
location, where transfer costs are zero. It is the average between c (variable Costs) and a/b (the price at which no sales would be made,
that is, the vertical intercept of the demand curve). For sales to all other
markets, the ideal delivered price increases with distance just half as fast as
the transfer cost does. (Compare Appendix 3-1.)
11. For a discussion of several issues concerning
basing-point pricing and additional references to this topic, see David D.
Haddock, "Basing-Point Pricing: Competitive vs. Collusive Theories," American Economic Review, 72, 3 (June 1982), 289-306. Haddock points out
that the basing-point system need not imply collusion among sellers, and he
discusses the economic incentive for this pricing behavior when commodities are
traded interregionally.
Handy
references on the varieties of spatial competition and pricing systems include
Beckmann, Location Theory, pp. 30-50; and M. L. Greenhut, Microeconomics and the Space Economy (Chicago: Scott, Foresman, 1963).
Mathematical statements generalizing the theory of spatial pricing can be found
in Martin J. Beckmann, "Spatial Price Policies Revisited," Bell Journal of
Economics, 7, 2 (Autumn 1976), 619-630; and in Daniel F. Spulber, "Spatial
Nonlinear Pricing," American Economic Review, 71, 5 (December 1981),
923-933.
12. Harold Hotelling, "Stability in Competition," Economic Journal, 39 (March 1929), 41-57.
13. B. Curtis Eaton and Richard Lipsey make this point
in the development of their work. See Eaton and Lipsey, "Comparison Shopping
and the Clustering of Homogeneous Firms," Journal of Regional Science, 19, 4 (November 1979), 421-435.
14. The framework for the analysis of the examples to
follow was established by Arthur Smithies, "Optimal Location in Spatial
Competition," Journal of Political Economy, 49 (June 1941), 423-439.
Edward C. Prescott and Michael Vischer, "Sequential Location Among Firms with
Foresight," Bell Journal of Economics, 8,2 (Autumn 1977), 378-393,
substantially expand the theoretical perspective on related problems by
examining the behavior of firms that try to anticipate the decision rules used
by later entrants to the market.
15. The profit of each of the sellers would be maximized
if they assumed quartile locations— that is, if the boundary between the
sellers were at the midpoint of the market, and each seller located in the
center of its market segment. In this way, average transfer costs on delivery
of the product to customers in each market segment would be minimized, and
sales would therefore be maximized.
16. We distinguish here between uncertainty concerning
such factors as shifting markets, shifting sources of supply, transportation
costs, taxes, etc. (or uncertainty concerning the "state of nature") as
introduced in Chapter 2 on the one hand, and
uncertainty concerning rivals on the other.
17. See Michael J. Webber, Impact of Uncertainty on
Location (Cambridge, Mass.: MIT Press, 1972). These are but two examples of
the implications that can be drawn from an analysis of location decisions under
uncertainty. The interested reader will find Webber’s text a useful
introduction to the related literature.
18. In an activity characterized by market-area
boundaries that are blurred for any of the reasons discussed earlier,
evaluation of the market potentialities of any location is somewhat more
complicated: The locator must estimate what its market share will be in the
penumbra of its market area where this overlaps with that of one or more
competitors. See also the discussion in Section
2.8.
19. A fascinating popular treatment of such space
relations as the anthropologist sees them is Edward T. Hall, The Hidden
Dimension (New York: Anchor Books, 1966).
20. As noted earlier in this chapter, other spatial
pricing alternatives are available. See, for example, the discussion on basing-point pricing and Daniel F. Spulber, "Spatial
Nonlinear Pricing," American Economic Review, 71, 5 (December 1981),
923-933.
21. Beckmann, Location Theory.
22. lbid., pp. 32, 51, 52. Beckmann’s formulas have
been translated here into our notation. He assumed t =l, and he wrote a/b where we have h, and b where we
have g.
