5.I INTRODUCTION
The
discussion in Chapter 4 concerned the market-area
or supply-area patterns of activities in which there is strong spatial
repulsion among the individual units. In sharp contrast, however, other
activities show highly clustered patterns.
Cluster is,
of course, the logical pattern for units of an output-oriented activity whose
markets are concentrated at one or a few locations, and correspondingly for
units of an activity oriented to inputs whose source locations are few. There
is a high concentration of producers and suppliers of such theatrical inputs as
actors, stage designers, and theatrical makeup specialists in Los Angeles and
New York because so much movie making and theater activity is concentrated
there. The making of vintage wines is confined to the relatively few areas
where the right kinds of grapes will flourish.
There are
other situations, however, where the basis for clustering is the mutual
attraction among the competing units of a particular activity, and this
attraction outweighs any repulsion that might arise from their rivalry. Thus a
frequent practice of chain-store firms is to locate branch stores as close as
possible to a competitor’s branch store. A tendency toward agglomeration
is unmistakable in the juxtaposition of car sales-rooms along "automobile rows"
and in the formation of financial districts, nightlife districts, civic
centers, produce markets, and high-class shopping areas in cities. The larger
the city, the more specialized and numerous are such neighborhood
agglomerations. In New York, large advertising agencies are so clustered along
a section of Madison Avenue that the street has given its name to the industry.
Similarly, a section of Seventh Avenue is preempted by the garment trades, part
of Forty-seventh Street by diamond merchants, and so on for many other
specialties. The common feature of all such clusterings is that each unit finds
the location good because of the presence of the others. There is a
positive mutual attraction rather than a repulsion. The explanation of
such mutual-attraction clusters lies in special characteristics of the activity
itself, its markets, or its suppliers.
5.2 EXTERNAL ECONOMIES: OUTPUT VARIETY AND MARKET
ATTRACTION
In some
activities, the basic reason for the agglomerative tendency is that the outputs
of individual units are not standardized; they are not perfect substitutes for
one another, and moreover, they differ in such manifold and changing ways that
they cannot be satisfactorily compared by the buyer without actual inspection.
The locational significance of this characteristic can best be seen by a pair
of contrasting examples.
A
manufacturing firm buying sheet steel simply decides on its specifications and
then finds out which steel producer will give the best price and fastest
delivery. A visit to warehouses or rolling mills to look over the sheets and
make a selection is unnecessary, because the specifications themselves (plus
conceivably a sample sent for testing in the buyer’s plant or laboratory)
fully identify the characteristics of the steel. Consequently, the transfer
costs involved are those of shipping the steel from producer to user, and there
is nothing in the situation that would make it desirable or convenient for the
rival sheet steel producers to be concentrated in one place.
Contrast
this with a man or woman buying a car or a new hat, a department store
selecting its line of fall fashions, or a fashion designer searching for
something simply devastating in novelty buttons. In any of these cases, the
buyer does not know exactly what will be purchased. He or she will be selecting
one item (in the case of the car) or maybe more (in the case of the hat) or a
very large number (in the case of the department store’s fall line). The
items cannot be adequately described in a catalog, and it would be much too
expensive and time consuming for the producers to supply each prospective buyer
with a full set of samples. Under these circumstances, the "demand" is not so
much demand for specific items as it is demand for a varied display of
products; and the wider the variety presented at a particular location, the
more demand that location will attract.
Therefore
the buyer makes a shopping trip, preferring the largest display center
accessible to him. The more he is prepared to spend, the farther he will be
prepared to go in the interest of variety. Thus most of us would be willing to
journey farther out of our way to select a camera than a necktie; still farther
to select a new car; and still farther to select a job with career
possibilities.
It is clear
that the activity that is presenting the displays will tend to adopt a
clustered pattern, with its units positively attracting one another. A newcomer
to the cluster may even be welcomed, because that seller will enrich the
variety and draw still more demand to the location.
It should
be noted also that where comparison shopping is important, the significant
transfer costs are borne by the buyer, and the major element in transfer costs
is personal travel time. The transfer of the goods bought may be handled by the
buyer himself (he may drive his new car home or carry his other purchases). In
any event, however, the transfer cost is not enough to counteract the advantage
(to both buyers and sellers) of having the selling units
agglomerated.
When the
purchases are transferred separately, it is of course feasible to separate
production or delivery, or both, from display. Thus new car dealers sometimes
have to order from the nearest assembly plant after the buyer has made his
choice; and in recent years more and more garment producers have moved their
factories out of the city in order to reduce production costs, and maintain in
the city only the functions of display and associated entertainment for the
out-of-town buyers.
These
examples illustrate one important kind of external economy of agglomeration of an activity—"external" to the individual unit involved because the
advantages depend on how many other units of its type are joining it to make a
cluster that attracts demand.1
5.3
EXTERNAL ECONOMIES: CHARACTERISTICS OF THE PRODUCTION PROCESS
5.3.1 Introduction
The
externalities associated with the size of a cluster are by no means limited to
those that enhance demand as a result of the characteristics of shopping
behavior. Some closely analogous external economies of agglomeration involve
cost and supply considerations, and these tend to affect many of the same
activities.
If products
are complexly differentiated and changeable from one day or week to the next,
the chances are that at least some of the inputs also share those
characteristics. Thus a fashion garment shop will have a constantly changing
need for different fabrics, thread, buttons, zippers, and the like. With the
nature of the output continually changing, manpower needs can vary
unpredictably and suddenly; with speedy delivery at a premium and production
scheduling intricate, equipment repairs and parts must be quickly available.
Since perhaps the most important task of the manager is to estimate what the
buyers will want and what his or her rivals will offer, a crucial input is
fresh information, gathered largely by mixing with the right people and keeping
the eyes and ears open.
Every one
of these input requirements, plus others, is best satisfied in a tight cluster.
The basic reason can be made clear by the following example. Suppose we have a
small plant that manufactures ladies’ coats. A long sequence of separate
operations is involved, including such operations as cutting and binding the
buttonholes. Specialized equipment exists for making buttonholes rapidly and
cheaply in large quantities, but it represents a sizable investment. Individual
coat manufacturers would not find it worthwhile to invest in such a machine,
since they could not keep it busy all the time; they have to resort to making
their buttonholes in a slower way, involving greater labor cost. However, if
they locate in a cluster with enough other clothing manufacturers, their
combined need for buttonholes may suffice to keep at least one of the
specialized buttonhole machines reasonably busy. Then a separate firm
specializing in buttonhole making joins the cluster. The clothing manufacturers
contract that operation out to that firm, to the advantage of all concerned,
including the customer who gets the coat cheaper.
This
example can be extended to embrace dozens of other individual operations that
likewise can be delegated to specialized firms when there is a cluster,
enabling a sufficient number of firms using the specialized service to enjoy
convenient access to the specialist.
5.3.2 External Economies and Scale
Some highly
significant facts emerge from this discussion. First, we have explained an external economy for the clothing manufacturers in terms of the internal economies entailed in specialized operations (the
buttonhole-making establishment and other such auxiliary suppliers must have at
least a certain minimum amount of business or they cannot cover their fixed
costs). Second, the result of the mutually beneficial symbiosis of the garment
makers and the buttonhole maker is that the former are now also more
specialized. They are confining themselves to a narrower range of operations,
and for any given level of output of coats they will have smaller plants and
fewer employees; that is, the productivity of inputs will be enhanced.
There is another advantage in this. The principal constraint on the size of
their plants is the complexity of management decision making in an industry
where the products are continually changing (in response to or in anticipation
of a volatile demand), orders are small, and the production cycle is of
extremely short duration; specialization should enhance efficiency here as
well. A further constraint, in many cases, is the supply of capital for the
individual entrepreneur.
For a given
establishment or firm, these gains in production efficiency may be illustrated
graphically by reference to Figure 5-1. If, as the
result of specialization, the location unit within an activity cluster can take
advantage of internal economies of scale, subsequent increases in productivity
will move the unit down along its average total cost curve. Thus in panel (a)
of Figure 5-1, location within the cluster has made it possible to increase the
rate of output from Q0, to Q1, with a consequent decrease in average total costs
from ATC()to ATC1.
The
increased efficiency in production that results from the cluster of activity
may show up also as a decrease in average total costs at each rate of
output. As shown in panel (b) of Figure 5-1, this would imply a downward
shift in costs from ATC to ATC’. Such a change could stem
from several sources. For example, if scale economies are achieved by members
of the cluster, the products and services they produce will be available to all
buyers at lower cost. Hence the per unit cost of inputs will fall for any buyer
using their outputs, including those buyers who are also members of the
cluster. Similarly, any savings in transfer costs realized by members of the
cluster would have the effect of lowering average total costs. Other such
sources of economies might include the ability of group members to maintain
smaller inventories in the face of demand or supply uncertainties, increases in
labor productivity resulting from specialization in the work place, or
increased efficiency in management and organization.
It is also
important to note that in an industry where these agglomeration economies are
realized, there is little or no rationale for the development of multiplant
firms. As we have pointed out, the economic size of the individual plant in
such industries is effectively limited by the problems faced by management.
There is no point in the firm’s establishing branch plants; all the
activity is at one location, and the management must constantly give close
attention to what is going on inside the plant. This situation contrasts
sharply with that of a business such as food retailing, where the constraint
upon the size of an individual store is the maximum size of its market area
(reflecting transfer costs). The multistore firm enjoys great advantages in
mass purchasing, advertising, research, financing, and management; the optimum
firm size far exceeds optimum store size.
In summary,
we can distinguish three levels at which economies of size appear in respect to
any particular activity.2 These are (1) economies
associated with size of the individual location unit (plant, store, or
the like); (2) economies associated with the size of the individual firm; and (3) economies associated with the size of the agglomeration of that
activity at a location. We can refer to these, for brevity’s sake,
as unit, firm, and cluster3 economies, and the size at which each of these economies peaks can be thought of as
the optimum unit size, the optimum firm size, and the optimum cluster
size.4
These
optima are determined by the characteristics of the activity, including its
locational sensitivity to transfer costs and other locational factors. When
firm optimum is larger than unit optimum, there are multiunit firms with
operating branches, ordinarily in different locations, as in retail chains and
some kinds of manufacturing. Otherwise, the single-unit firm is the norm. When
cluster optimum exceeds the optimum for units or firms, there are multiunit
and/or multifirm clusters of the activity; otherwise, separate locations are
the norm, as is illustrated by primary processing plants for farm or forest
products.
5.3.3 Lichtenberg’s Study of "External-Economy
Industries"
The classic
analysis of the clustering of certain manufacturing industries on the basis of
agglomeration economies external to the individual location unit and firm was
made in the late 1950s by Robert M. Lichtenberg for the New York Metropolitan
Region Study. Table 5-1 (below) lists the 87 industries that he identified as
dominated by external-economy factors of Location and that are relatively
concentrated in the New York metropolitan region.
| TABLE 5-1: Manufacturing
Industries Relatively Concentrated in New York City by External Economies,
1954 |
|
Industry |
New York Metropolitan Region’s Share of Total U.S.
Employment (percent) |
|
Hatters’
fur |
99.9* |
|
Lapidary
work |
99.5* |
|
Artists’
materials |
91.9* |
|
Fur goods |
90.4 |
|
Dolls |
87.4* |
|
Schiffli-machine
embroideries |
86.5 |
|
Hat and cap
materials |
85.7 |
|
Suspenders and
garters |
84.7* |
|
Women’s
neckwear and scarves |
84.7 |
|
Hairwork |
82.7* |
|
Embroideries, except
Schiffli |
80.0 |
|
Tucking, pleating,
and stitching |
76.8 |
|
Handbags and
purses |
75.6 |
|
Tobacco
pipes |
75.3 |
|
Millinery |
64.7 |
|
Children’s
coats |
61.6 |
|
Belts |
60.9* |
|
Artificial
flowers |
60.6 |
|
Women’s suits,
coats, and skirts |
58.8 |
|
Dresses, unit
price |
58.7 |
|
Furs, dressed and
dyed |
56.9* |
|
Umbrellas, parasols,
and canes |
54.5* |
|
Robes and dressing
gowns |
54.3 |
|
Small leather
goods |
53.1 |
|
Miscellaneous
bookbinding work |
53.0* |
|
Handkerchiefs |
49.8* |
|
Buttons |
49.5 |
|
Trimmings and art
goods |
49.0 |
|
Men’s and
boys’ neckwear |
48.3 |
|
Watchcases |
48.1* |
|
Phonograph
records |
48.0* |
|
Books, publishing
and printing |
46.8 |
|
Periodicals |
46.5 |
|
Lamp
shades |
46.0 |
|
Corsets and allied
garments |
45.9 |
|
Children’s
outerwear, n.e.c+ |
43.2 |
|
Knit outerwear
mills |
42.3 |
|
Blouses |
41.7 |
|
Finishing wool
textiles |
41.5 |
|
Bookbinding |
41.1 |
|
Jewelry |
40.5 |
|
Suit and coat
findings |
39.6 |
|
Costume
jewelry |
39.5 |
|
Children’s
dresses |
39.3 |
|
Men’s and
boys’ cloth hats |
38.0 |
|
Waterproof outer
garments |
37.6 |
Printing ink |
34.7 |
Coated fabrics,
except rubberized |
34.5* |
Women’s and
children’s underwear |
34.4 |
Luggage |
34.3 |
Apparel,
n.e.c. |
34.0 |
Needles, pins, and
fasteners |
33.8 |
Jewelry and
instrument cases |
33.7 |
Engraving and plate
printing |
33.6 |
Miscellaneous
publishing |
33.3 |
Curtains and
draperies |
32.9 |
Typesetting |
32.9 |
Straw hats |
32.8* |
Women’s
outerwear, n.e.c. |
32.7 |
Jewelers’
findings |
32.6* |
Games and toys,
n.e.c. |
32.1 |
Engraving on
metal |
30.4 |
Leather and
sheep-lined clothing |
30.4 |
Textile products,
n.e.c. |
30.4 |
China decorating for
the trade |
29.0 |
Housefurnishings |
28.9 |
Photoengraving |
28.2 |
Book
printing |
25.5 |
Electrotyping and
stereotyping |
25.5 |
Fabric dress
gloves |
25.3 |
Greeting
cards |
25.2 |
Galvanizing |
24.4* |
Candles |
23.5 |
Mirror and picture
frames |
22.7 |
Men’s and
boys’ suits and coats |
22.3 |
Knitting mills,
n.e.c. |
21.2 |
Finishing textiles,
except wool |
20.6 |
Signs and
advertising displays |
20.4 |
Plating and
polishing |
18.7 |
Knit fabric
mills |
18.3 |
Lithographing |
17.9 |
Enameling and
lacquering |
16.7 |
Statuary and art
goods |
16.6 |
Commercial
printing |
16.5 |
Felt goods,
n.e.c. |
16.0* |
Narrow fabric
mills |
15.4 |
Dresses,
dozen-price |
12.9 |
*Approximate
figure estimated by Lichtenberg: exact figures unavailable because of Census
disclosure rules.
+n.e.c.: not elsewhere classified.
Source Robert M. Lichtenberg, One-Tenth of a Nation (Cambridge, Mass.:
Harvard University Press, 1960), pp. 265-268; based on data from U.S. Census of
Manufactures, 1954.
"Relatively
concentrated" means that the region’s share of national employment in the
industry exceeded 10.4 percent—which was the region’s share of total
national employment and accounts for the title of Lichtenberg’s
book.5
Lichtenberg’s study provides documentation and illustration on
some of the points we developed earlier. Table 5-2 sums up some salient characteristics of those manufacturing industries that he
rated as least affected by transport orientation. It covers, in his words, "all
industries for which the dominant locational factor is inertia, Labor, or
external economies, and those for which no dominant locational factor could be
assigned." It is clear from this tabulation that prevalence of single-unit
firms (which we previously noted as a characteristic of industries clustered
because of external economies) is associated with small size of plant, high
labor intensity (as suggested by small energy use per worker), and (for
consumer goods industries) small inventories implying fast turnover.
Table 5-3 examines the relation between degree of
concentration in New York and proportion of single-plant firms, in the same set
of industries as in the preceding table. Industries most heavily clustered in
the New York metropolitan region are consistently characterized by a prevalence
of single-plant firms. In other words, New York as the chief metropolis of the
nation appears to have strong special attractions for industries of the
single-plant type, which, as Table 5-2 showed, are
characterized by small units and high labor intensity.
Table 5-4 compares average plant size (number of
employees per establishment) in the New York metropolitan region and in the
United States as a whole, for different classes of industries. In
transport-sensitive industries selling to national markets (the first row of
figures in the table), the situation is roughly as follows: New York plants are
larger than plants elsewhere in industries that show a definite tendency to
concentrate in New York (that is, the region has more than 20 percent of
national employment). This relationship seems to make sense. In a
market-oriented industry, we should expect that the main centers of the
industry would have the largest plants, since they are the locations with best
access to markets, and the economic size of plants in such industries is
constrained primarily by the added transport costs involved in serving a wider
market area. In addition, at least four of the transport-sensitive
national-market industries6 most heavily
concentrated in New York (chewing gum, rattan and willow ware, copper refining,
and cork products) use imported materials, and New York’s status as a
major port of entry helps to explain its advantage.
The
external-economy industries, which are nearly all rather highly concentrated in
the New York region, show a significantly contrasting size relationship.
Despite the great prominence of New York as a location for such industries, the
plants there are smaller than those elsewhere. This should be expected
according to the considerations already discussed. A plant of an
external-economy industry located in New York is in a position to contract out
more operations to specialists, such as our buttonhole maker. Within any Census
industry classification, those firms and plants that to the greatest degree
share the special characteristics of clustered external-economy activities
(such as variable demand and product, rapid production cycle, and low degree of
mechanization) will be the ones most likely to find the New York location
attractive; and those characteristics are, as we have seen, strongly associated
with small plant size. Plants in the same Census industry located elsewhere are
more likely to be turning out a less variable kind of product, and their
optimum plant size is somewhat larger.
Thus
industries of the clustered type have, as a class, the peculiar characteristic
of operating in smaller units (in terms of both plant and firm) in locations of
major concentration than they do elsewhere.
5.4 SINGLE-ACTIVITY CLUSTERS AND URBANIZATION
5.4.1 Introduction
The
advantages of a clustered location pattern for certain types of activities are
now apparent. But what does such a cluster contain besides the major
beneficiary of those advantages?
There are
certainly some types of clusters that need contain nothing else—for
example, "automobile rows." Here the mere juxtaposition of a number of
salesrooms makes the area attractive to prospective buyers, and that is the
basis of the agglomeration tendency. The same is true for many other types of
single-activity neighborhood cluster in cities, such as art shops, antique
stores, secondhand bookstores, wholesale and retail produce markets, and the
like.
But in each
of those cases, what really draws the buyers is variety. There would be no
advantage in agglomeration (so far as buyers are concerned) if the wares of the
different sellers were identical. Accordingly, still other product lines or
activities may contribute to the advantage of the cluster, provided they offer
something that the same buyers might want to pick up on the same trip. In this
way, the attractions of a cluster of high-fashion dress shops may well be
enhanced by the addition of a shop specializing in high-fashion shoes or
jewelry, or even a travel agency catering to high-income travelers. At a more
plebeian level, the familiar suburban shopping center includes a wide
assortment of retail trade and service activities. The developers of the center
usually plan rather closely in advance the kinds of businesses to be included
and take pains to pin down at least some of the key tenants (such as a
department store branch, a bank, or a movie theater) even before ground is
broken. Other relatively broad and diverse clusters based on the attraction of
a common demand are recreation centers and cultural centers.7
Just as
externalities associated with shopping behavior imply advantages for clusters
of closely related activities, a cluster in which availability of common
inputs plays an important role (such as in the external-economy industries
analyzed by Lichtenberg) is also more likely to be a complex of closely
related activities than just a clump of units of one activity. Thus an
essential part of a cluster that is advantageous to garment manufacturers is a
variety of such related activities as machine rental and repair; designing;
provision of special components such as buttonholes, fasteners, and ornaments;
trucking services; and so on. Indeed, the Lichtenberg list includes such
ancillary activities indiscriminately along with the producers of garments and
other final products; this is quite fitting, since it is the tightly knit
complex of activities that yields the external economies that help motivate the
cluster.
5.4.2 Urbanization Economies
Our
examples suggest that the process of identifying an activity cluster is
somewhat more complicated than might first appear. Detailed examination of a
large activity cluster discloses that while some constituent activities (such
as buttonhole making) are so specialized that they are locationally associated
with just one line of activity, others (such as trucking or forwarding
services, entertainment facilities for visiting buyers, and a variety of
business services) are not so restricted. They are essentially elements of a
large urban agglomeration. Their presence, and the quality and variety of the
services they offer, depend more on the size of the city than on the
size of the local concentration of any of the activities they serve.
Economies
generated by activities and services of this sort are external to any
single-activity cluster, but they are internal to the urban area. There is a
parallel to be drawn here to the relationship between a single-activity cluster
and its constituent units. In that instance, economies were realized by the units as the size of the cluster increased; thus economies are
internal to the cluster but external to the unit. In the case of urbanization economies, we recognize that economies accrue to
constituent clusters as the size of the urban area increases. Thus some of the
advantages that a particular activity gets by concentrating in New York could
not be duplicated by simply having an equal amount of that activity clustered
in, say, Columbus, Ohio—though, of course, it is possible that Columbus
might offer some compensating attractions of a different nature.
There have
been, and still are, some noteworthy multifirm clusters of single activities in
relatively small places (historic examples are glove making in Gloversville,
New York; hat making in Danbury, Connecticut; and furniture making in Grand
Rapids, Michigan). But it is apparent that this type of single-activity cluster
(in which the bulk of an activity is found in a few "one-industry towns") has
rather gone out of style since F. S. Hall proclaimed its heyday in 1900.8 Such concentrations depended heavily on the external
economies of a pool of specialized labor skilled in operations peculiar to one
industry, and often predominantly of one nationality group;9 on a reservoir and tradition of entrepreneurship similarly
specialized; and on the inertial factor of acquired reputation. Technological
changes and enhancement of the mobility of labor and entrepreneurship explain
why such local specialization has become increasingly rare. By contrast,
external economies on the broader basis of urban size and diversity have
remained a powerful locational force.
5.4.3 Measuring Urbanization Economies
The
symbiotic relationships within single-activity clusters or more complex
clusters reflecting urbanization economies have important implications, both
for constituent activities and for the regional economy as a whole. As a
consequence, much effort has been devoted to understanding and measuring
agglomeration economies. Many people concerned with the growth and development
of specific regions have examined the advantages inherent in urban
concentrations, in an effort to understand the factors most relevant to their
region’s prosperity and problems.
Our
examination of agglomerative forces suggests that they may affect an individual
location unit either through market demand considerations or through
modifications of the production process that enhance efficiency. The evaluation
of either or both of these effects entails some challenging
difficulties.
Recent
efforts to measure the extent of urbanization economies have focused on
estimates of the productivity gain accruing to activities that are located in
larger urban areas. They proceed by treating production in urban areas as being
representative of the aggregate production of component activities. For
example, if one were to estimate the aggregate demand for labor in Boston or
Detroit, one would assume that the behavior of this aggregate reflects a
weighted average of labor demand curves associated with all activities in the
city.
Measurements of this sort rest on the belief that the demand for
factors of production is determined by the value of their marginal product,
that is, marginal physical product multiplied by the price of the good or
service being produced. Because of this, the demand for inputs, including
labor, would reflect the advantages of agglomeration economies. Whether the
source of these economies is due to the size of the location unit, firm,
cluster, or urban area, any associated increase in factor productivity would
show up in the urban area’s demand for labor. With this in mind,
researchers interested in measuring agglomeration economies have reasoned that
by the comparison of labor markets associated with cities of different size, it
might be possible to isolate the contribution of urbanization economies to
labor productivity. Further, if it were possible to isolate a measure of aggregate efficiency in production due to these forces, we would also
have a measure of their average effect on the activities that make up
the urban areas in question.10
Reference
to Figure 5-2 will help to explain and reinforce these
ideas. The lines Da and Dbrepresent
estimates of the aggregate demand for labor in two different urban areas, (a) and (b). Dbis that associated with the larger of
the two. It is drawn to the right of Da in order
to reflect the fact that for any given level of employment, the value of
labor’s marginal product is greater in the larger urban area. This
productivity difference remains even after one accounts for differences in the
size of the capital stock and the "quality" of labor between these
areas.
If the two
urban areas faced the same labor supply function, Sl, equilibrium
employment in each would be given by Eaand Eb; labor is hired up to the point where the value of its marginal product
(given by Daand Db) is equal to the wage
rate. Because of this, the total value of goods and services produced in either
urban area is given by the area under its respective labor demand curve, up to
the level of equilibrium employment. Therefore, the shaded area, EaEbcdef is the increase in factor productivity
associated with larger urban size.11
Estimates
of this measure of urbanization economies have varied from study to study, and
a consensus is not easily drawn. The findings of two early research efforts
have gained wide recognition, however, and will serve to illustrate the kind of
results obtained.12
David Segal
obtained estimates of aggregate production functions along with their implied
labor demand functions for 58 metropolitan areas, using 1967 data. A simplified
version of the functional form he uses is given by

where Q is output, K is capital stock, and L is employment
(quality adjusted) in city i.13 Technical efficiency is characterized by the multiplicative constant ASc, where S is a dummy variable denoting size, and A and c are parameters. Segal finds constant returns to scale in
aggregate production (a + b=1), and estimates of c are of the
order of .08 for cities with populations of 2 to 3 million. This translates to
an 8 percent productivity gain (the shaded area in Figure
5-2) for metropolitan areas when this population threshold is
reached.
In a study
of fourteen industries also based on 1967 data, Leo Sveikauskas finds that an
average productivity gain of about 6 percent can be expected with each doubling
of city size. He reaches this conclusion by regressing the logarithm of output
per worker (productivity) in a given industry on the logarithm of population
and on an index of labor quality across a large sample of cities. Sveikauskas
recognizes that these productivity differences may be due to differences in
capital intensity across cities; if the ratio of capital to labor (K/L) is large, output per worker will also be large. However, upon investigation
he finds that the variation in capital intensity is not sufficient to account
for the observed productivity differences.
Productivity advantages of this magnitude can mean a substantial
competitive edge. They can be a powerful locational incentive and may well have
played an important role in encouraging shifts in the spatial distribution of
economic activity toward urban areas during much of the postwar period.14
Many
problems confront efforts to measure external economies accruing to activities
in urban areas, and it is important to keep the limitations of related research
in mind. Some types of externalities associated with clusters are not
necessarily related to urban size and are therefore omitted from measurements
of the sort described here. Others are not manifest in productivity differences
at all; rather, they are reflected in demand considerations. Further, because
of data constraints, measurement efforts have been limited to highly aggregate
analysis, whereas many of the most interesting aspects of agglomeration
economies can be appreciated only at a much more micro level. The method
described in this section is nevertheless representative of the kind of
systematic effort that is required to address these and other issues related to
the measurement of this important phenomenon.
5.5 MIXED SITUATIONS
In order to
bring out certain controlling factors, we have been considering sharply
contrasting types of activity location patterns. We have distinguished patterns
dominated by mutual repulsion from those dominated by mutual attraction. We have also distinguished patterns involving market areas from patterns involving supply areas.
It is now
time to recognize that in the real world there are various intermediate stages
between the extreme cases described. In one and the same activity, it is not
uncommon to find (1) dispersive forces dominant at one level of spatial detail
and agglomerative forces dominant at another level, or (2) coexistence of
market-area and supply-area patterns. Let us take a brief look at each of these
types of "mixed" situations.
5.5.1 Attraction plus Repulsion
In any
given activity, the forces of repulsion and attraction among units are usually
both present in some degree, even though one generally predominates. Thus in an
activity characterized by a mosaic of market areas, some of the locations will
have more than one plant, store, or other such unit. Though we think of retail
grocery stores or gasoline stations as primarily mutually repulsive, it is not
uncommon to find groupings of two or more adjacent competitors showing some
degree of mutual attraction. Being at essentially the same location, these
rival units are likely to share the same market area, though one might have a
somewhat wider reach than another. If we think of them as simply sharing "the
market area of that location," the statements made earlier about market-area
determination and pricing policies are still largely valid, except that spatial
pricing systems involving systematic transfer cost absorption become less
feasible when the seller is not alone at its location.15
Similarly,
an activity that we think of as basically clustered, such as the making of
fashion garments, often has several widely separated clusters. Among the
external-economy industries of New York enumerated in Table 5-1, it will be
noted that only a few come close to being exclusively concentrated in
the New York region. The rest are found also in substantial, lesser clusters in
other large cities. One reason for replication of clusters is, of course, that
over long distances transfer costs (in time if not in money) become a
significant constraint on concentration relative to far-flung markets or input
sources. Thus, when we look at the country as a whole, we see a pattern of
market or supply areas showing some force of mutual repulsion among competing
centers. If such an activity is concentrated primarily in, say, New York, Los
Angeles, and Chicago, there will be three roughly demarcated market areas or
supply areas, each shared by all the members of the corresponding cluster. In
this connection, it is much more likely that market areas rather than supply
areas will be involved, since most external-economy activities produce
transferable outputs that need fast delivery to rather widespread markets, and
their transferable inputs come from fewer sources and are of a more staple
character.
5.5.2 Coexistence of Market Areas and Supply Areas, When Both
Sellers and Buyers Are Dispersed
Somewhat
different from the case just discussed is a not uncommon situation in which
there are many selling locations and many markets, and not necessarily any
significant clustering tendencies at all. Sales from one producing district are
distributed over many market points, and at the same time any one market
district buys from many supplying points. The situation does not lend itself to
analysis purely in terms of a set of supply areas or a set of market areas.
How, then, can we most effectively analyze such a pattern?
Except in
the unlikely situation in which the patterns of supply and demand coincide
(which would mean that no transfer is required and that each point is
self-sufficient in this particular product), there will be surplus areas where
local output exceeds local consumption, and deficit areas where the opposite
situation prevails. The product will be transferred from surplus areas to
deficit areas; and in order to motivate the flow, there must be a price
differential corresponding to the costs of transfer along the paths of
flow.
The
relationship between price patterns and transfer can be demonstrated as
follows. Suppose we were to map the spatial variations in the price of the
good, depicting a price surface by plotting a set of contour lines, each
connecting points at which the price is at some particular level. The iso
price lines (isotims) corresponding to the highest prices would occur in
the principal deficit areas, and those corresponding to the lowest prices would
occur in the principal surplus areas. The price gradient along any path would
be determined by the frequency with which we cross successive isoprice contours
as we traverse that path. Shipments of the commodity would be most likely to
occur along the paths with the steepest price gradients, and such paths would
cross the isoprice lines at right angles. Actual shipments would occur wherever
there is a price gradient at least as steep as the gradient of transfer costs;
and in an equilibrium situation, we should expect that these shipments would
result in no price gradient being substantially steeper than the transfer cost
gradient.
Such a
graphic analysis does not, however, explicitly recognize the relation between
supply and demand patterns that creates the price differentials giving rise to
shipments. William Warntz has suggested an empirically feasible shortcut method
of measuring this supply-demand relation that utilizes the access potential
index described later.16
For any
given point i, we can construct an index of local and nearby supply, or
"access to supply," by the following formula:

where sj is the output at any supply location j,
tij, is the transfer cost from that supply location j to the given point i, and x is an exponent empirically
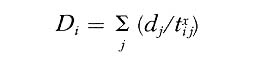
chosen to provide the best fit to the observed statistics. For the same point i, we can construct also an index of local and nearby demand, or access
to market, by the analogous formula:
With both
indices derived for each location, we can identify surplus areas as those where
the supply index is greater than the demand index, and deficit areas as those
for which the demand index is greater than the supply index. We should expect
that spatial variations of the price of the good should be positively
correlated with the demand index and negatively correlated with the supply
index; this expectation was borne out in some of Warntz’s studies of the
price patterns of agricultural commodities.
5.6 SUMMARY
Just as
some activities are characterized by mutual repulsion among units, others are
characterized by cohesive or clustering (agglomerative) forces. These forces
may result from demand or production (supply) characteristics of the activity
in question.
In some
instances, each unit finds advantage in locating near others of the same kind
primarily because the units are not exactly identical. This generally happens
when the output is varied and changing somewhat unpredictably, so that buyers
need to "shop"—that is, to compare various sellers’ offerings.
Selling locations attract buyers according to how wide a choice they can offer;
therefore, sellers gain by being part of a large cluster.
Further
agglomerative forces arise from the external economies of a cluster large
enough to support a variety of highly specialized suppliers of inputs: labor,
components, services, and so forth. These clusters also are characteristic of
activities dealing with nonstandardized and perishable outputs and inputs. In
such activities the units are small and generally only one to a firm.
Lichtenberg’s classic study of external-economy industries showed the
nature of such clustering and its importance in the economy of a large
metropolis such as New York.
As the size
of an urban area increases, it becomes capable of supporting activities and
services that are external to any cluster but that generate economies for a
number of clusters. Urbanization economies of this sort imply important
advantages for activities located in large metropolitan areas, where we observe
complexes of interacting activities.
Although a
contrast has been drawn between activities dominated by mutual repulsion of
units and those dominated by mutual attraction (agglomeration), there are some
elements of both mutual repulsion and attraction in many activities. There are
also many situations in which sellers have market areas, and buyers at the same
time have supply areas.
TECHNICAL TERMS INTRODUCED IN THIS
CHAPTER
|
External economies of
agglomeration |
Urbanization
economies |
|
Unit
economies |
Price
surface |
|
Firm
economies |
Isoprice line, or
isotim |
|
Cluster
economies |
|
SELECTED READINGS
Brian J. L.
Berry, Geography of Market Centers and Retail Distribution (Englewood
Cliffs, N.J.: Prentice-Hall, 1967).
Stan
Czamanski and Luiz Augusto de Q. Ablas, "Identification of Industrial Clusters
and Complexes: A Comparison of Methods and Findings," Urban Studies, 16,
1 (February 1979), 61-80.
Robert M.
Lichtenberg, One-Tenth of a Nation (Cambridge, Mass.: Harvard University
Press, 1958).
Hugh 0. Nourse, Regional
Economics (New York: McGraw-Hill, 1968), pp. 85-92.
Harry W. Richardson, Urban Economics (Hinsdale, Ill.: Dryden Press, 1978), Chapter
3.
David Segal, Urban
Economics (Homewood, Ill.: Richard D. Irwin, 1977), Chapter 4.
ENDNOTES
1. B. Curtis Eaton and Richard G. Lipsey. "Comparison Shopping and
the Clustering of Homogeneous Firms," Journal of Regional Science, 19, 4
(November 1979), 421-435, examine some locational implications of comparison
shopping in a more theoretical context.
2. In Section 5.4 we shall distinguish yet another
level at which economies of size may appear; there, we shall find that such
economies are also associated with urbanization per se.
3. What are here identified as "cluster" economies are sometimes
referred to as economies of localization. Alfred Marshall’s succinct
characterization of the ‘economies of localized industries" is often
quoted from his Principles of Economics, 8th ed. (London: Macmillan,
1925), Book IV, Chapter 10. F. S. Hall’s Census monograph, "The
Localization of Industries" (U.S. Census of 1900, Manufactures, Part 1,
pp. cxc—ccxiv), reported on the development of highly clustered patterns
of individual manufacturing industries toward the end of the nineteenth
century. Unfortunately, however, the term "localization" has also been used
synonymously with "location" and even in the sense of "dispersion," so it is
best avoided.
4. A thorough and original discussion of business organization and
location in terms of these several optima appears in E. A. G. Robinson, The
Structure of Competitive Industry, rev. ed. (Chicago: University of Chicago
Press, 1958).
5. Robert M. Lichtenberg, One-Tenth of a Nation (Cambridge,
Mass.: Harvard University Press, 1960). Lichtenberg’s list of
"external-economy industries" includes five more, in which the region’s
share was less than 10.4 percent: industrial patterns and molds, separate
trousers, men’s dress shirts and nightwear, woolen and worsted fabrics,
and special dies, tools, and metal-working machinery attachments. He does not
explicitly categorize any nonmanufacturing activities as
external-economy-oriented though he does discuss the heavy concentration of
central offices of large industrial corporations in the New York metropolitan
region Among the 500 largest such corporations as listed by Fortune magazine in 1959, 155 (31 percent) maintained their headquarters in the
region. The region’s share was greater still for the largest corporations,
rising to 44.2 percent of those with $750 million or more in assets (ibid., Chapter 5 and specifically Table .37, p. 155).
6. Lichtenberg gives a full listing of industries by locational
category in ibid., Appendix B.
7. For an empirical analysis of cluster tendencies involving related
lines of retail trade, see Arthur Getis and Judith M. Getis, "Retail Store
Spatial Affinities," Urban Studies, 5, 3 (November 1968), 317-322. For a
sophisticated and challenging empirical analysis of which activities cluster
with which, see Joel Bergsman, Peter Greenston, and Robert Healy, "The
Agglomeration Process in Urban Growth," Urban Studies,9, 3 (October
1972), 263-288; and for a survey of related literature, see Stan Czamanski and
Luiz Augusto de Q. Ablas, "Identification of Industrial Clusters and Complexes:
A Comparison of Methods and Findings," Urban Studies, 16, 1 (February
1979), 61-80.
8.
Hall’s 1900 Census monograph, previously cited, gives numerous further
examples.
9. Economic historians have often noted the important role of the
influx of Germans to the United States in the mid-nineteenth century in
establishing concentrations of certain industries in which they had special
skills, such as optical and other scientific instruments in Rochester, brewing
in Milwaukee and St. Louis, and tanning and shoemaking in these and other
Midwestern cities.
10. A second approach to this measurement problem
entails the direct estimation of the returns to scale exhibited by activities
in metropolitan areas. Gerald A. Carlino, "Increasing Returns to Scale in
Metropolitan Manufacturing," Journal of Regional Science, 19, 3 (August
1979), 363-373, provides estimates of this sort and attempts to decompose them
into economies related to the size of the unit, cluster, or urban area
associated with a given activity.
11. The assumption that the same wage rate prevails in
both cities implies that this productivity difference reflects a long-run
equilibrium in which spatial factor price differentials have been eliminated.
In fact, the labor supply curve may be positively inclined, indicating that
higher wages must be paid to attract more workers. Indeed, it may even be
necessary to pay workers higher wages in order to compensate for the
"disamenities" of urban life. (On this point see Oded Izraeli, "Externalities
and Intercity Wage and Price Differentials," in George S. Tolley, Philip E.
Graves, and John L. Gardner (eds.), Urban Growth Policy in a Market Economy [New York: Academic Press, 1979], pp. 159-194.) Recognition of these labor
supply conditions would imply that adjustments to the measure of productivity
gain described above are required in order to "net-out" these effects and
identify "real" productivity gains. The reader interested in these issues
should see Michael S. Fogarty and Gasper Garofalo, "An Exploration of the Real
Productivity Effects of Cities," Review of Regional Studies, 8,1 (Spring
1978), 65-82; and Fogarty and Garofalo, "Urban Size and the Amenity Structure
of Cities," Journal of Urban Economics, 8,3 (November 1980), 350-361.
Fogarty and Garofalo use the graphical analysis presented here to develop
perspective on their related work and explore the concept of "real
productivity" in some depth.
12. See David Segal, "Are There Returns to Scale in City
Size?" Review of Economics and Statistics, 58, 3 (August 1976), 339-350;
and Leo A. Sveikauskas, "The Productivity of Cities," Quarterly Journal of
Economics, 89, 3 (August 1975), 392-413. For qualifications and extensions
of the method and results presented by these authors, see the articles by
Fogarty and Garofalo cited in the preceding footnote and Ronald L. Moomaw,
"Productivity and City Size: A Critique of the Evidence," Quarterly Journal
of Economics, 94, 4 (November 1981), 675-688.
13. Actually, Segal accounts for differences in labor
quality among cities by setting b = kßkqikwhere qik reflects the city’s labor force composition
by education, sex, race, and age. He also includes a vector of site
characteristics (accounting for climate, natural resources, etc.) in the
multiplicative constant.
kßkqikwhere qik reflects the city’s labor force composition
by education, sex, race, and age. He also includes a vector of site
characteristics (accounting for climate, natural resources, etc.) in the
multiplicative constant.
14. In Chapter 8, we
shall find that the growth rate of nonmetropolitan areas has exceeded that of
metropolitan areas in recent years. Some researchers have speculated that this
also may be due to the changing structure of agglomeration
economies.
15. If there are many sellers of a standardized
commodity at one location, so that they are in nearly perfect competition, any
seller could dispose of its entire output while confining its sales to that
part of the market providing the largest profit margin. Consequently, any
attempt to establish a discriminatory pricing system would break down.
16. William Warntz, Toward a Geography of Price (Philadelphia: University of Pennsylvania Press, 1959).
